Objective
Select like-minded users from a local community website.
Pre-requisites
- A Drupal website with the votingapi module enabled and at least a few dozen votes by registered users.
- A working installation of the R language.
Exract data
For each user, select all other users that voted on same node and comments:
SELECT v1.uid uid1, v2.uid uid2, u1.name name1, u2.name name2,
  v2.entity_id entity_id, v1.value value1, v2.value value2
FROM votingapi_vote v1
JOIN (votingapi_vote v2, users u1, users u2)
 ON (v1.uid != v2.uid AND v1.entity_id=v2.entity_id
   AND v1.entity_type=v2.entity_type AND v1.uid=u1.uid AND v2.uid=u2.uid)
WHERE v1.uid < v2.uid AND v1.uid != 0 AND v2.uid != 0
ORDER BY v1.uid,v2.uid;
This produces a table
uid1    uid2    name1   name2   value1  value2
1       2       Administrator   Bob     100     100
1       2       Administrator   Bob     20      20
1       2       Administrator   Bob     40      40
1       2       Administrator   Bob     100     100
1       2       Administrator   Bob     20      100
1       2       Administrator   Bob     100     100
1       2       Administrator   Bob     100     100
1       2       Administrator   Bob     100     100
1       2       Administrator   Bob     100     100
1       2       Administrator   Bob     80      80
1       2       Administrator   Bob     100     20
1       2       Administrator   Bob     20      20
1       2       Administrator   Bob     60      60
1       2       Administrator   Bob     100     100
1       2       Administrator   Bob     100     100
with five columns:
- first user id
- second user id
- first user's name
- second user's name
- vote of the first user
- vote of the second user
The important parts in the SQL are
- the JOIN on the same table, which allows to generate all permutations of uid1 and uid2
- the WHERE clause on
v1.uid < v2.uidwhich reduces permutations to combinations.
The uid of 0 is skipped, because it is the uid of the anonymous user. Every anonymous vote is attributed to it.
Calculate similarity
It can be done in PHP, but why bother? Here's a handy R script that takes the above table as in.tsv and produces, for each user, a file with the following columns:
- id of the other user
- username
- number of votes in common
- Pearson's correlation coefficient between votes
- a p-value that indicates how certain was the algorithm.
#!/usr/bin/env Rscript
d <- read.delim("in.tsv")

unique1 <- unique(c(d$uid1, d$uid2))

for (id1 in unique1) {
  if (file.exists(as.character(id1))) {
    file.remove(as.character(id1))
  }
  temp1 <- d[d$uid1==id1 | d$uid2==id1, ]
  unique2 <- unique(c(temp1$uid1, temp1$uid2))
  unique2 <- unique2[!unique2 == id1] # remove id1
  for (id2 in unique2) {
    if (id1 < id2) {
      result <- temp1[temp1$uid1==id1 & temp1$uid2==id2, ]
      name <- as.character(result$name2[1])
    } else {
      result <- temp1[temp1$uid1==id2 & temp1$uid2==id1, ]
      name <- as.character(result$name1[1])
    }
    n = nrow(result)

    if (n > 7) {
      x <- result$value1
      y <- result$value2
      pvalue <- cor.test(x,y)$p.value
      if (is.finite(pvalue) && pvalue < 0.05) {
        correlation <- cor(x,y)
        cat(id2, name, n, correlation, pvalue, "\n", sep = "\t", file = paste(id1, sep = ""), append = T)
      }
    }
  }
}
Notice the use of the cor(x,y) function that calculates the correlation and cor.test(x,y) that produces additional metrics for the correlation, including p-value. By convention, everything above p-value < 0.05 is considered uncertain, so we only print lines where p-value < 0.05. Jiggling with id1 and id2, and the if-else block are there to select pairs of users in any order.
Here's the output from the above data:
2 Bob 15 0.6039604 0.01710946
Display results
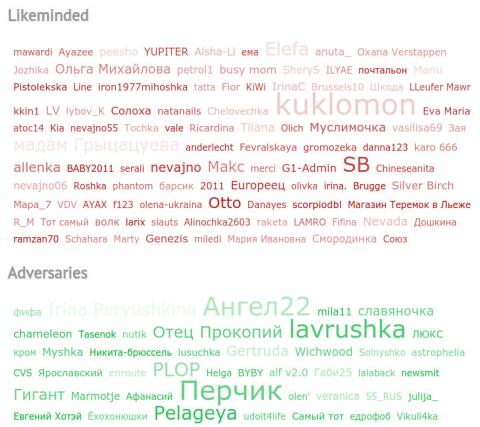
The rest is fairly obvious. I've chosen to display the data as a tag cloud on user profiles. With a hook on hook_menu,
/**
 * Hook into the user menu
 */
function mymodule_menu() {
  $items['user/%user/likeminded'] = array(
    'access callback' => TRUE,
    'access arguments' => array(1),
    'page callback' => 'mymodule_likeminded', // function defined below
    'page arguments' => array(1),
    'title' => 'Likeminded',
    'weight' => 5,
    'type' => MENU_LOCAL_TASK,
  );
  return $items;
}
I fetch the user's data file as generated by the R script above and display the data from it in a bag of words of varying sizes:
/**
* Display likeminded users
*/
function mymodule_likeminded($arg){
if (is_object($arg) && !$arg->uid) {
return;
}
# this is my path to the results, your path may be different
$path = drupal_get_path('module', 'mymodule') . '/pearsons/' . $arg->uid;
$lines = array();
$min = 0; $max = 0;
if ($handle = @fopen($path, 'r')) {
while($line = fgets($handle)) {
$line = explode("\t", $line);
if ($line[2] >= $max) { $max = $line[2]; }
if ($line[2] < $min) { $min = $line[2]; }
$lines[] = $line;
}
}
$output = '';
// Likeminded
$output .= '' .t('Likeminded') .'
' ;
$output .= '';
foreach($lines as &$line) {
if ($line[3] > 0 ) {
$size =mymodule_font_size($min, $max, $line[2]);
$opacity = $line[3];
$output .= "";
$output .= l($line[1], 'user/' . $line[0]);
$output .= "";
}
}
$output .= '';
// Adversaries
$output .= '' .t('Adversaries') .'
' ;
$output .= '';
foreach($lines as &$line) {
if ($line[3] < 0 ) {
$size =mymodule_font_size($min, $max, $line[2]);
$opacity = abs($line[3]);
$output .= "";
$output .= l($line[1], 'user/' . $line[0]);
$output .= "";
}
}
$output .= '';
return $output;
}
/**
* calculate the font size in proportion to the maximum and minimum of common votes
*/
function mymodule_font_size($min_count, $max_count, $cur_count,
$min_font_size=11, $max_font_size=36) {
if ($min_count == $max_count) # avoid DivideByZero exception
{
return $min_font_size;
}
return (
($max_font_size - $min_font_size)
/
($max_count - $min_count)
*
($cur_count - $min_count) + $min_font_size);
}
That's it.
This approach scales fairly well. It takes around one minute to extract the data and around 30 minutes to calculate similarity on a database of 100 000 users, 1 000 000 posts and 4 500 000 votes, all on the same server that runs the website.
The lead image shows a real user profile page with a selection of like-minded users and adversaries.
P.S. If there's enough interest, I will rewrite the above code as a Drupal module.
P.P.S. Want to datamine your own data and receive an understandable explanation afterwards? Drop me a line.
